Cryptocurrency faced major headwinds throughout 2022 as monetary tightening and recession fears took center stage. With inflation and rate expectations triggering the initial decline, the fundamental backdrop remains key for price action in 2023.
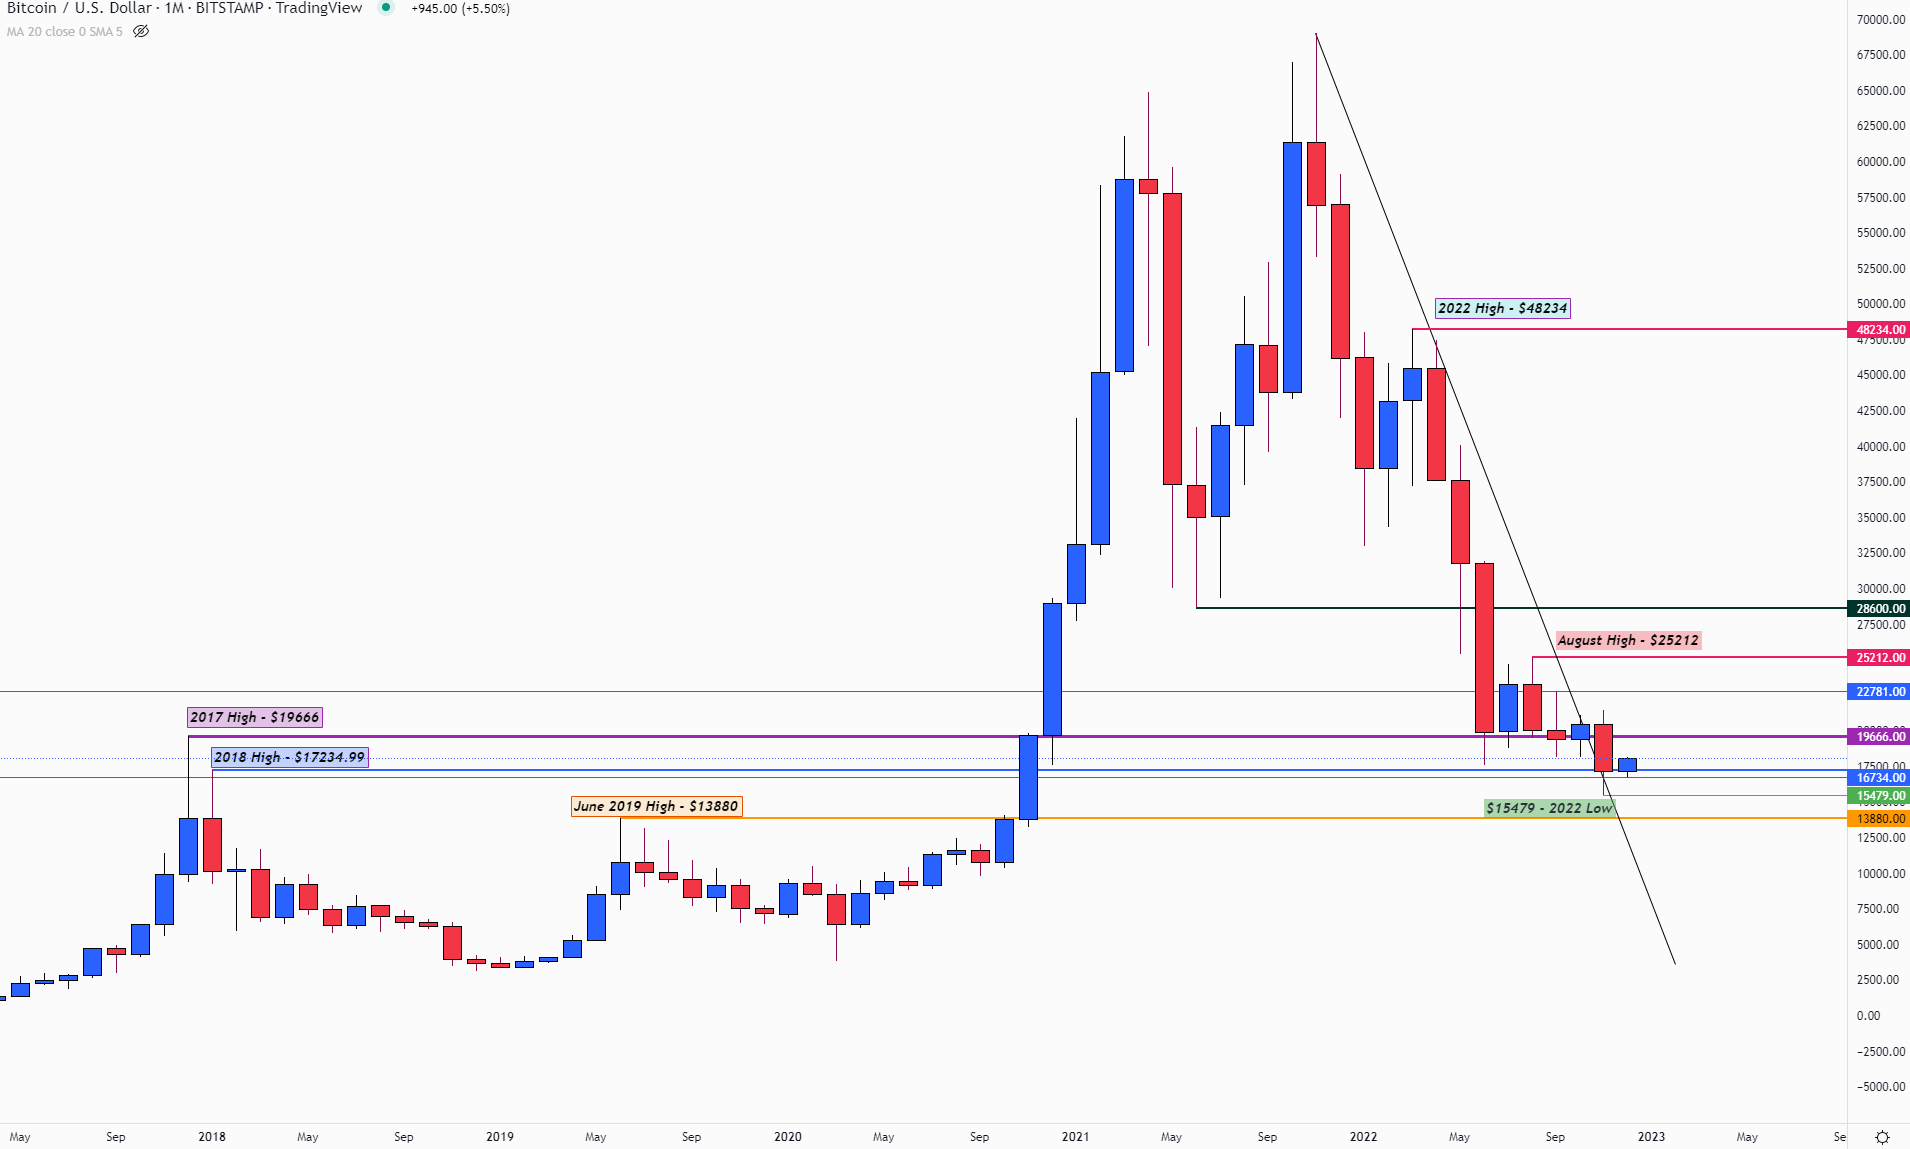
From a mid-November, two-year low of 15,479, Bitcoin prices recovered through the mid-December to eventually crest 17,000. Despite the turn in the final two months, BTCUSD maintained a remarkably narrow range between the a fore mentioned low and resistance around 18,300 which was support from June to November.
Although digital assets remain vulnerable to surges in volatility, narrow bodied candles are often indicative of slowing momentum. The weekly candles seen through the second half of last year fall into a tapering range, leaving a hold above the November low 15,479 and subsequent break of 18,300 necessary to drive a recovery.
Bitcoin (BTC/USD) Weekly Chart
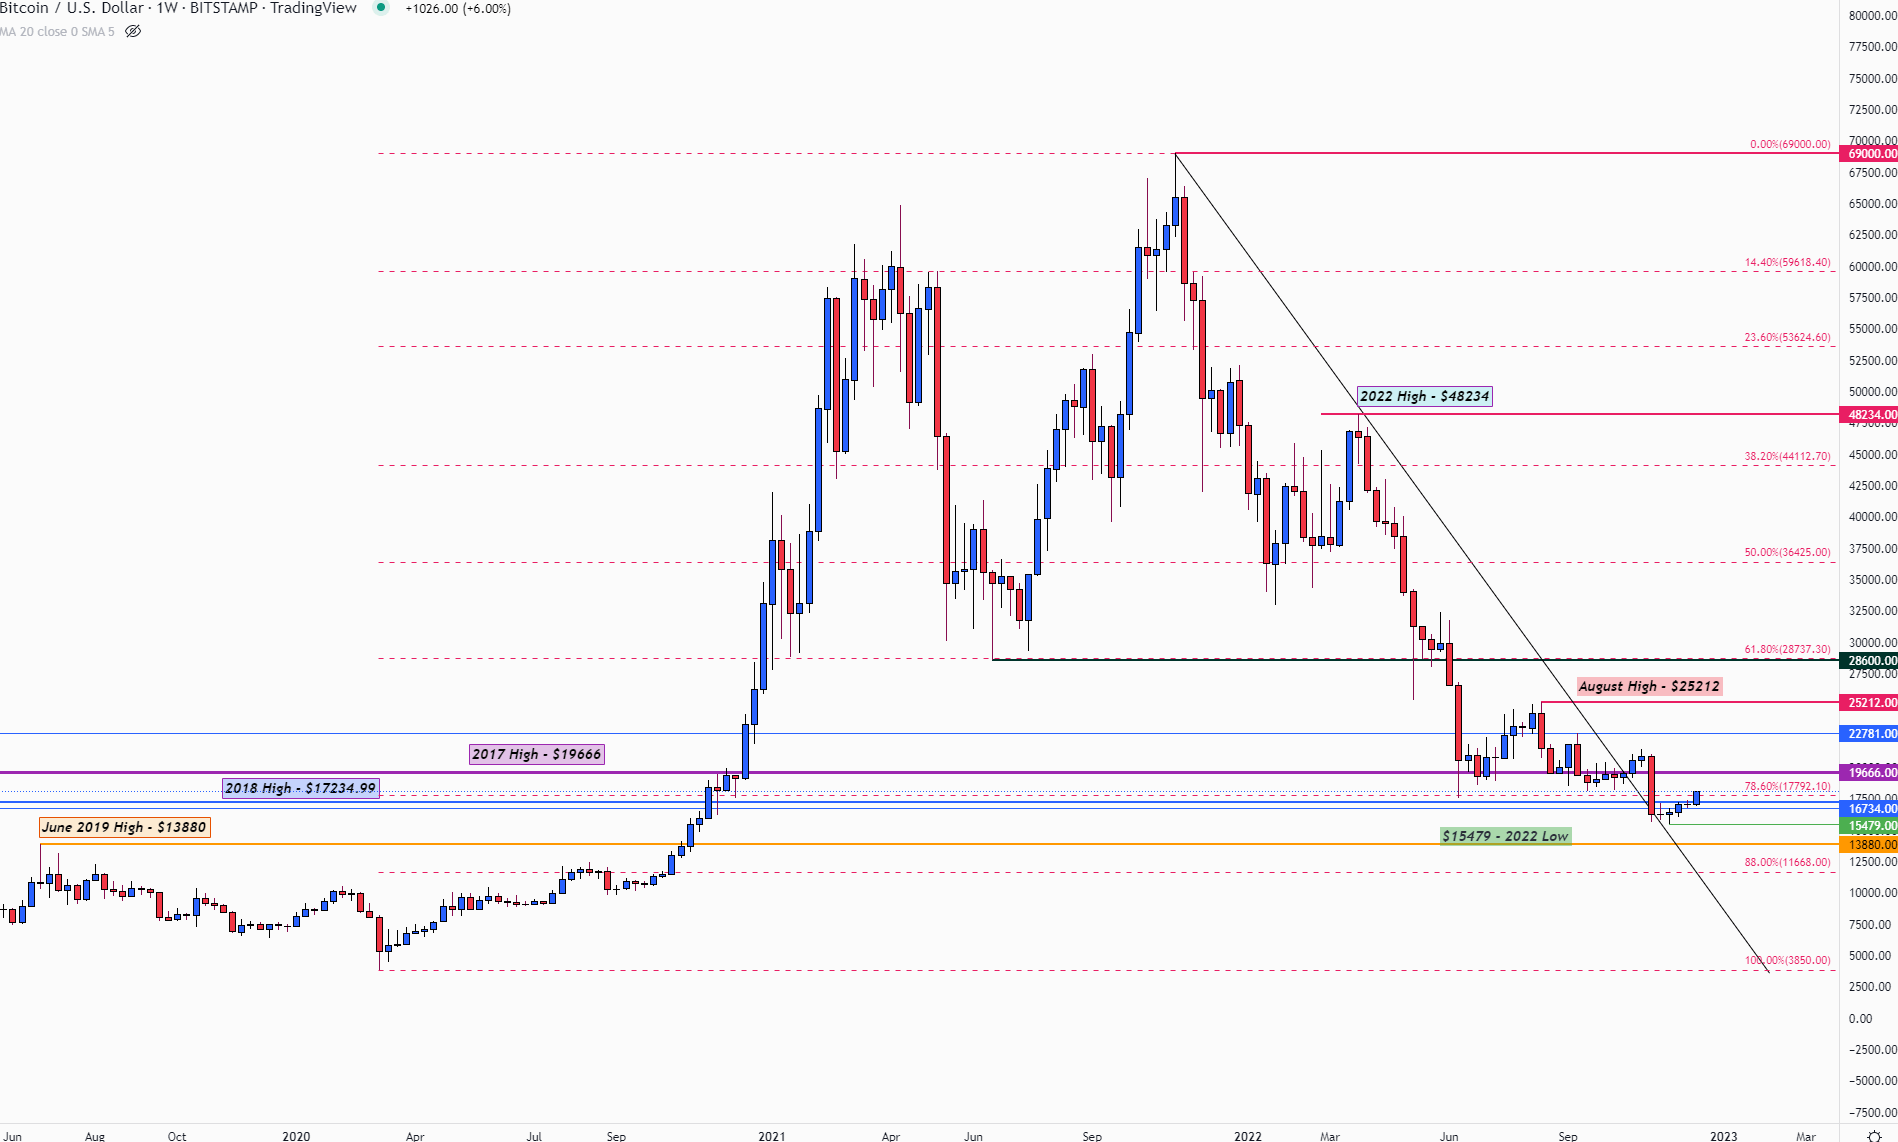
Further, with the 78.6% Fibonacci retracement of the March 2020 – November 2021 moves just above at 17,792, bulls still have some big levels to clear before gaining traction. For upside momentum to take over a move above the 2017 high at 19,666 could provide further guidance with the next barrier up at 22,781.
With upside barriers noted, the bearish trajectory is still intact. Failure to hold above 17,000 could place pressure the ability to promote stability. If Bitcoin drops below 15,479, a retest of the 2019 high of 13,880 could add to selling pressure towards the round 10,000 mark. Although a more extreme stretch could potentially drive lows back to March 2020 levels at 3,850, the ability to hold above 10,000 could keep the market broadly steady in the interim.
Bitcoin (BTC/USD) Monthly Chart
source: dailyfx